May 5, 2020 | Excel, Powerpoint, Training, Uncategorized
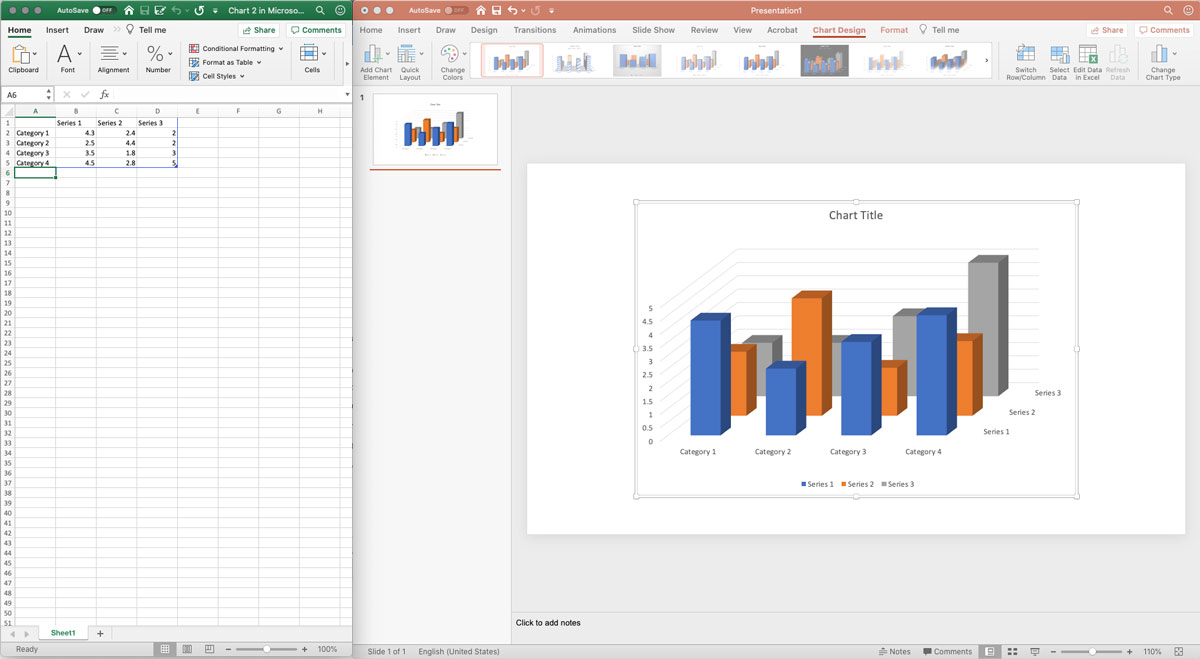
Everyone likes a good story. You have a story and you have data to back it up, but raw data can be hard to read. So, how can you make data interesting, easy to understand, and presentable? You can use data visualization which is the graphical representation of...


