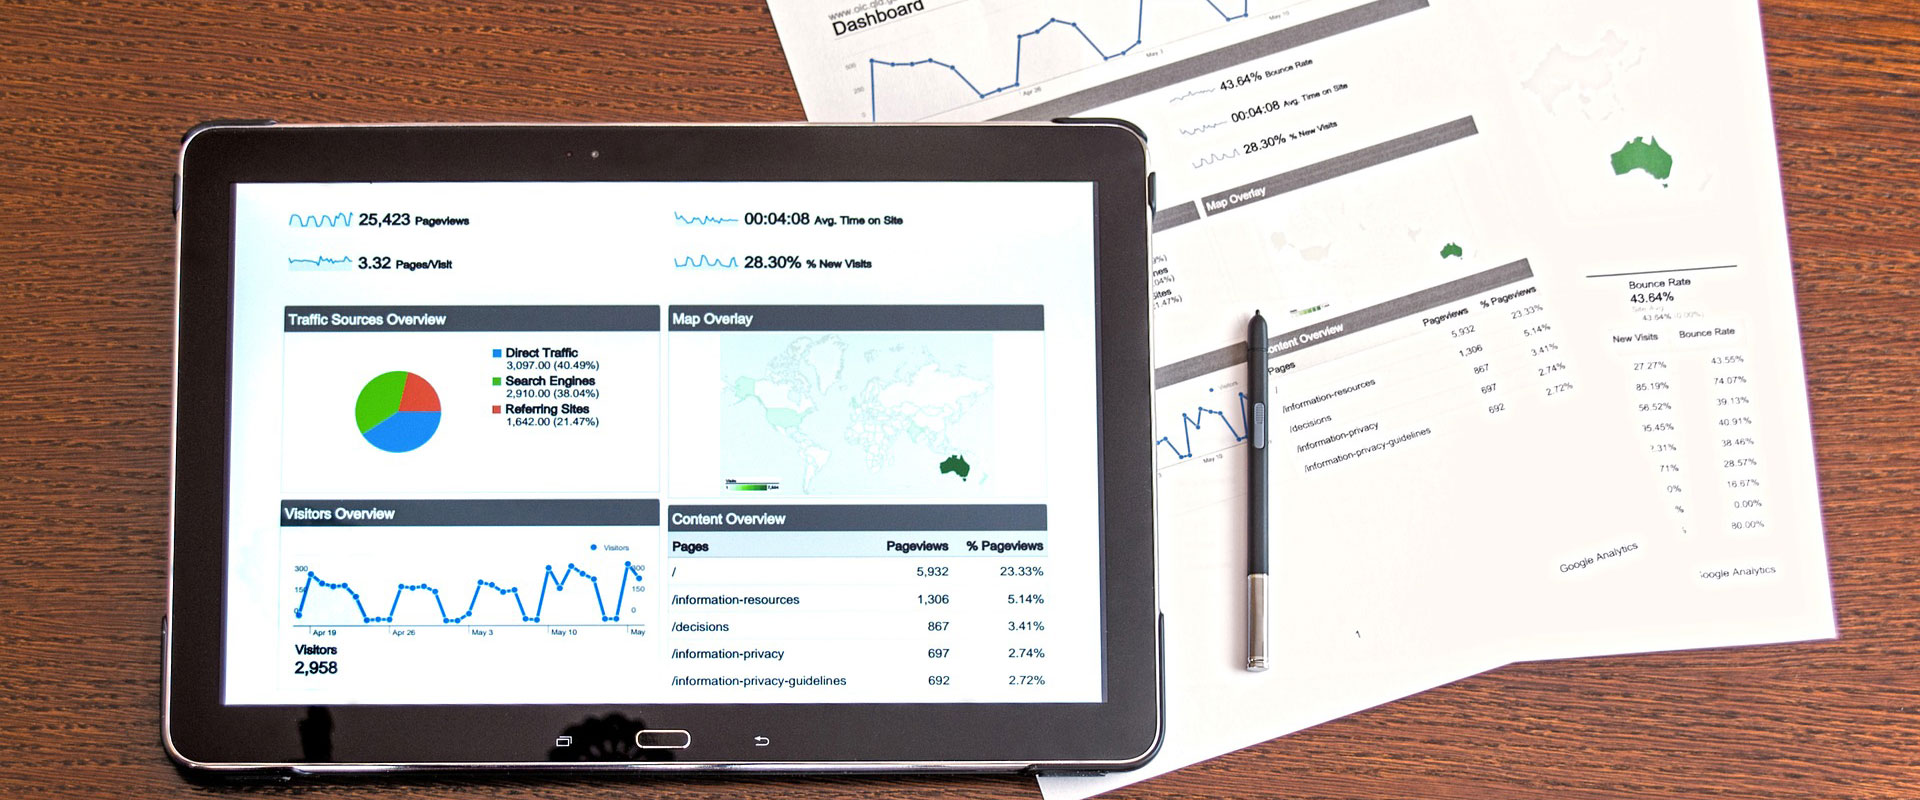
Google Analytics has been around since November 2005. It changed how we measured website traffic and in the last 14 years, it has evolved tremendously to include tracking Adwords and custom events through Google Tag Manager. On top of this, Google Analytics offers 78 standard reports under five categories. That is a lot of reports and thinking about Google Analytics can make you hyperventilate
Hyperventilation obviously is not Google’s end goal for you. Google wants you to be able to track user behavior and understand your target audience so that you can make business decisions that will profit your small business. It is not necessary for you to analyze all 78 reports. It is, however, necessary for you to analyze the right reports for two reasons.
- The right reports help stay focused on your business goals. When you know what you want to accomplish with your website and google ad campaigns, whether it is lead generation or brand awareness, you can analyze the reports that are most relevant to your business goals.
- The right reports help you stay consistent. If you and your team do not have goals, it is very easy to jump around. This often happens when someone asks a question that about a metric which leads you down a rabbit hole. When you know your goals and have the best reports in place, you can keep the conversation on track.
To help you focus on the right reports for your goals, Google created Dashboards. Dashboards lets you create custom reports and metrics using a collection of widgets as well as share them. This is very helpful when you want to monitor a metric from one report and a metric from another report.
When you create a new Dashboard under Customization, you may find yourself a little overwhelmed once again with the choices and variations. Fortunately, you can find free templates of dashboards that align with common business goals. Here are a few that you can download to help you get started.
- Traffic Growth
- Audience Snapshot/Digital Marketing
- Content Analysis/Marketing
- Ecommerce
- Social Media
When you create Google Analytics Dashboards, you will be able to focus on the right reports as a group and make better business decisions, because everyone will be on the same page. Rabbit trails and irrelevant reports derail your goals. If you have not already created Google Analytics Dashboards, now is the time. Meet with your team. Decide on your goals together and then create dashboards to help you measure those goals. If you have questions about Google Analytics Dashboards, please contact us.


